Great Britain · 2020–2025
2020 – 2025 Unit Prices
Annual average Ofgem price-cap allowances, converted to an equivalent pence-per-kWh figure for a 3,100 kWh electricity customer.
The key finding: wholesale costs fell sharply after the crisis peak, but by 2025 they were still above 2020, while network and policy allowances had become structurally larger.
Methodology and data table
Figures are annual calendar-year averages reconstructed from Ofgem’s pre-levelised default tariff cap models. Each component is the simple average of the regional allowances for a single-rate electricity customer using 3,100 kWh per year and paying by “Other Payment Method”.
Ofgem publishes these component allowances in annual pounds per benchmark customer, excluding VAT. They have been converted into an equivalent pence-per-kWh figure by dividing by 3,100 kWh, with 5% VAT then added. This means the total includes fixed and unit-rate costs and should not be read as the published tariff unit rate alone.
| Year | Wholesale | Networks | Policy | Operations | Margin | VAT | Total |
|---|---|---|---|---|---|---|---|
| 2020 | 7.28p | 4.56p | 3.68p | 3.66p | 0.37p | 0.98p | 20.51p |
| 2021 | 7.82p | 4.87p | 3.85p | 3.93p | 0.39p | 1.04p | 21.89p |
| 2022 | 20.22p | 6.16p | 4.03p | 4.27p | 0.66p | 1.77p | 37.11p |
| 2023 | 29.70p | 7.25p | 4.41p | 5.28p | 0.93p | 2.38p | 49.94p |
| 2024 | 12.54p | 7.14p | 5.04p | 4.82p | 0.74p | 1.51p | 31.80p |
| 2025 | 12.43p | 7.12p | 5.44p | 5.01p | 0.77p | 1.54p | 32.32p |
Primary source: Ofgem, Energy price cap levels: pre-levelised rates model, October–December 2025 edition, historical charge-restriction periods and component allowances. Categories combine DF and CM as wholesale; NC as networks; PC as policy; operating, smart-meter, payment-method, adjustment, debt-recovery, industry and headroom allowances as supplier and system operations; E as supplier margin.
If Electricity Is Cheaper to Generate, Why Are Bills Still So High?
Executive summary
Great Britain has added substantial amounts of wind and solar generation since 2020. These technologies can produce electricity at a relatively low operating cost, and wholesale prices frequently fall during periods of strong renewable output.
Yet domestic electricity remains considerably more expensive than it was before the 2022 energy crisis.
The initial increase is relatively easy to explain. International gas prices rose sharply, while gas-fired power stations frequently continued to set the marginal wholesale electricity price. Cheap wind, solar and nuclear generation did not prevent the wholesale market price from following the cost of gas.
The harder question is why household electricity prices did not return to their earlier level when wholesale prices fell from their crisis peak.
This page examines the changing cost of domestic electricity between 2020 and 2025. It separates wholesale energy from transmission, local distribution, balancing, policy costs, supplier costs, margins and VAT.
It also examines a second part of the problem: electricity is not always generated close to where it is needed. Scotland and northern Britain can produce more electricity than they consume, while major centres of demand are concentrated farther south. When the transmission network cannot carry all the available power, renewable generation may be curtailed and alternative generation closer to demand may be required.
The central argument is not that renewable energy made electricity expensive.
It is that:
The cost of generating electricity and the cost of operating the electricity system are two different things.
Renewable generation can reduce the cost of producing electricity while network, balancing and infrastructure costs still increase the final price paid by consumers.
The question
In 2020 and 2021, domestic electricity unit rates of approximately 15–20p per kilowatt-hour were common.
During the energy crisis, household electricity prices rose dramatically. The increase was driven principally by the wholesale energy market following the enormous rise in international gas prices.
Wholesale prices have since fallen substantially from their crisis peak, but domestic electricity has not returned to its former price.
That creates an apparent contradiction:
- Britain has more renewable generation.
- Wind and solar have very low costs.
- Wholesale electricity can be extremely cheap during periods of abundant supply.
- Domestic electricity remains much more expensive than before the crisis.
Where has the difference gone?
What is included in an electricity unit price?
A household electricity tariff does not pay only for electricity generation.
The final price must recover several different categories of cost:
Wholesale energy
This is the cost incurred by suppliers when buying electricity for their customers.
It is influenced by:
- gas and carbon prices
- renewable output
- nuclear availability
- electricity demand
- imports and exports
- weather
- forward purchasing and hedging
- the marginal generator required to meet demand
Wholesale costs are the part of the bill that rose most dramatically during the 2022 energy crisis.
Transmission network costs
The national transmission network carries large quantities of electricity over long distances at high voltage.
It connects:
- large power stations
- offshore wind farms
- major substations
- regional distribution networks
- electricity interconnectors
These costs are generally recovered through transmission network charges paid by generators and suppliers, which ultimately feed into consumer prices.
Distribution network costs
Distribution Network Operators run the regional networks that deliver electricity from the transmission system to homes and businesses.
Their costs include:
- local substations
- overhead lines and underground cables
- fault repairs
- network maintenance
- new connections
- reinforcement for additional demand
- accommodating local solar, batteries, electric vehicles and heat pumps
Transmission and distribution are separate parts of the electricity system and are regulated through different arrangements.
Balancing and system-operation costs
Electricity supply and demand must remain balanced continuously.
National Energy System Operator, or NESO, manages the system and purchases services needed to:
- increase or reduce generation
- manage transmission constraints
- maintain frequency
- hold reserve capacity
- manage unexpected plant failures
- respond to forecasting errors
A transmission constraint occurs when the network cannot carry all the electricity available in one area to the place where it is needed. NESO describes constraint management as necessary where congestion prevents power from being transmitted to the location of demand. (National Energy System Operator (NESO))
Policy and environmental costs
Electricity bills have also funded programmes including:
- renewable support mechanisms
- energy-efficiency schemes
- assistance for vulnerable households
- legacy environmental programmes
The precise schemes, exemptions and funding arrangements have changed over time.
For that reason, this analysis ends in 2025. Policy costs were restructured from 2026, which would make a direct comparison with earlier years less straightforward.
Supplier operating costs
Suppliers must recover the cost of:
- billing
- customer service
- meter services
- information technology
- bad debt
- regulatory compliance
- acquiring and retaining customers
Following the collapse of multiple suppliers during the energy crisis, consumers also paid for elements of the supplier-failure process through regulated allowances.
Supplier margin
Suppliers are permitted an allowance for profit within the default tariff cap.
This is not the same as the total difference between the wholesale price and the retail price. Most of that difference pays for other regulated or operational components.
VAT
Domestic electricity is subject to VAT at 5%. (Before October 2026)
Because VAT is charged as a percentage, it increases automatically when the underlying tariff rises.
Evidence chart: where each penny went, 2020–2025
The central chart on this page shows the estimated components of the domestic electricity price for each year from 2020 to 2025.
For each year, the total unit price is divided into:
- wholesale energy
- transmission
- distribution
- balancing and system operation
- policy and environmental programmes
- supplier operating costs and bad debt
- supplier margin
- VAT
The purpose of the chart is not to begin with the assumption that one particular category is responsible.
It is to test three questions:
- How much of the rise was caused by wholesale energy?
- Which non-wholesale costs increased between 2020 and 2025?
- Why did the fall in wholesale prices not restore the earlier retail unit price?
Ofgem publishes the methodology, models and component allowances used in calculating the default tariff cap, including separate wholesale and electricity-network cost models. (Ofgem)
However, comparing different years requires care.
The tariff-cap methodology has changed, typical consumption assumptions have changed, and some costs have moved between the unit rate and standing charge. The final chart therefore uses a consistent analytical method rather than simply copying headline cap figures from different periods.
Why cheap renewable generation does not guarantee a cheap retail tariff
Wind and solar have no fuel bill in the same sense as a gas-fired power station.
Once constructed, their short-run cost of producing another unit of electricity can be very low.
This can push wholesale market prices down during periods of abundant output. At times, the market price can approach zero or become negative because more electricity is available than the market can immediately use.
But households do not purchase only the output of the cheapest generator.
They pay for a system that must:
- work during low-wind periods
- move electricity around the country
- balance supply and demand
- maintain spare capacity
- fund networks
- support vulnerable consumers
- meet supplier and metering costs
- recover taxes and regulated obligations
This is why two statements can simultaneously be true:
Wind electricity can be cheap to generate.
and:
The complete electricity system can remain expensive to operate.
Gas and marginal pricing
Gas remains important because gas-fired generation is flexible and can be increased when demand rises or renewable output falls.
In the wholesale market, the final generator required to satisfy demand can influence the price received by other generators. When that marginal generator is a gas station, electricity prices can follow the cost of gas even where a large proportion of electricity is being generated by wind, solar or nuclear.
Ofgem’s assessment of the market has continued to identify gas being the marginal source of power as a major reason for high British electricity prices. (Ofgem)
This does not mean every unit of electricity costs as much to produce as gas generation.
It means the wholesale market price can be determined by the cost of the marginal unit needed to balance the system.
The 2022 crisis demonstrated the consequence of this structure. A relatively limited amount of expensive gas generation could influence the price paid across a much larger volume of electricity.
Is there a price before gas becomes marginal?
There is no single permanent national figure representing “the electricity price without gas”.
The counterfactual price depends on:
- demand at that moment
- wind and solar output
- nuclear and biomass availability
- imports
- storage
- available network capacity
- which generator would replace gas
- whether demand could be shifted or reduced
However, there are several useful ways to investigate the question.
Low-gas wholesale periods
Wholesale prices during periods of high renewable output and low gas generation provide evidence of what electricity can cost when gas has less influence on the market.
Generator capture prices
The average market price received by wind, solar, nuclear and other technologies can show how their output aligns with market prices.
Bid-stack modelling
A model can remove gas generation from the dispatch order and estimate which technology would become marginal instead.
This produces a counterfactual wholesale price, although it must also account for security of supply and network constraints.
Contracts for Difference
Some renewable generators receive an agreed strike price rather than relying solely on the wholesale market price.
When wholesale prices exceed the strike price, generators may return the difference through the scheme. These arrangements can reveal the effective contracted cost of some renewable output, although they are not directly equivalent to the retail unit rate.
The important point is that the retail electricity price cannot be calculated simply by averaging the production cost of wind, solar, nuclear and gas. The market, networks and balancing system sit between generation and the consumer.
Scotland: high generation and lower demand
Scotland has large amounts of onshore and offshore wind generation relative to its local electricity demand.
NESO states that generation capacity in Scotland significantly exceeds demand, meaning Scotland is expected to export power into England during most periods. It also identifies a series of internal Scottish and Scotland-to-England boundaries whose transfer requirements are increasing as more renewable generation connects. (National Energy System Operator (NESO))
During periods of strong wind:
- renewable output in Scotland can exceed local demand
- electricity must move south
- transmission boundaries can reach their operational limit
- some generation may need to be reduced
- alternative generation on the other side of the constraint may need to increase
This is not primarily a failure of the wind farm.
It is a mismatch between the location of generation, the location of demand and the carrying capacity of the network between them.
What happens when the network is constrained?
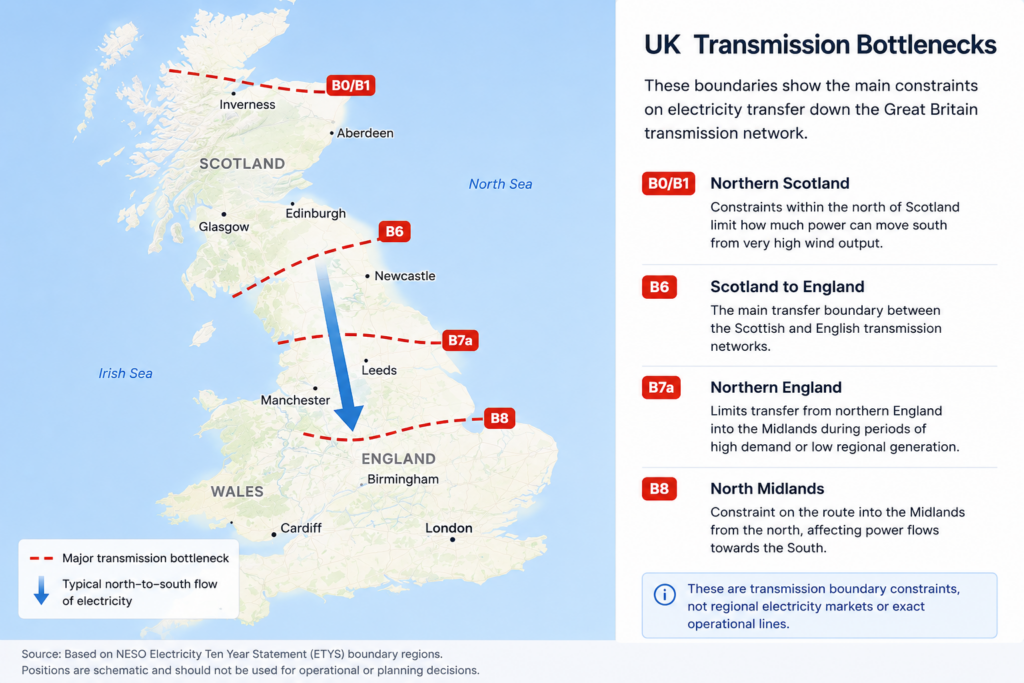
When a transmission boundary reaches its limit, NESO must alter the pattern of generation.
A simplified example would be:
- Wind farms north of a constraint are producing more electricity than the network can carry south.
- NESO pays or instructs some generation in the constrained area to reduce output.
- Generation south of the constraint is increased to meet demand.
- Consumers fund the net cost through balancing arrangements.
This can mean reducing low-carbon generation in one location while increasing gas generation elsewhere.
NESO has described circumstances in which Scottish wind generation is curtailed while generation in England is increased to meet demand. Its analysis reported approximately 4 TWh of Scottish wind curtailment during 2023. (National Energy System Operator (NESO))
The cost is not simply a payment to a wind farm for switching off.
It can include:
- the cost of reducing output in one location
- the cost of increasing output elsewhere
- the difference between the two actions
- other balancing and security measures required at the same time
NESO reports that constraint costs have risen as congestion has increased, including congestion associated with planned network outages and the growing volume of generation connecting to the system. (National Energy System Operator (NESO))
Did restrictions on English onshore wind increase system costs?
For much of the period covered by this analysis, planning policy made new onshore wind development in England exceptionally difficult.
More wind capacity was consequently developed offshore and in Scotland, where wind conditions and planning circumstances were generally more favourable.
It is reasonable to ask whether more geographically distributed onshore generation could have reduced some transmission requirements and constraint costs.
Onshore wind built closer to demand could potentially offer:
- shorter network connections
- reduced dependence on north-to-south transfer
- greater geographical diversity
- faster construction
- lower capital costs than some offshore projects
However, it would be too strong to claim that English onshore wind would have eliminated the network problem.
Wind output remains variable wherever turbines are located. Local networks may still need reinforcement, and the best wind resources are not necessarily close to the largest cities.
The evidence-based conclusion is narrower:
Restricting one of the cheapest and fastest forms of generation in England may have made the transition more dependent on generation located farther from major demand centres, increasing the importance of transmission investment.
The total financial effect should be modelled rather than assumed.
The cheapest generator may not create the cheapest system
Energy policy often compares technologies using the levelised cost of electricity.
This estimates the average lifetime cost of producing electricity from a generating asset. Government generation-cost assessments use levelised costs to compare technologies on a consistent basis. (GOV.UK)
This is useful, but it does not capture every wider system cost.
Consider two simplified projects.
Project A
- generation cost: 3p per kWh
- located far from demand
- requires major new transmission infrastructure
- frequently affected by constraints
Project B
- generation cost: 4p per kWh
- located closer to demand
- connects to a less constrained part of the network
- requires less reinforcement
Project A has the lower generation cost.
Project B could nevertheless impose the lower overall cost on consumers.
Policy should therefore consider:
- generation cost
- location
- transmission requirements
- connection cost
- output profile
- storage
- flexibility
- constraint risk
- the value of generation at different times and places
The objective should be the cheapest reliable electricity system, not merely the cheapest isolated generator.
Are network investment costs being funded appropriately?
Transmission lines, substations and major network assets can remain in service for many decades.
They benefit:
- today’s consumers
- future households
- future businesses
- future electric-vehicle users
- future heat-pump users
- future generators
That creates a legitimate financing question.
Should the full pressure of building long-lived national infrastructure appear quickly in current electricity bills, or should those costs be spread more evenly across the life of the assets?
Ofgem regulates network-company revenue through the RIIO price-control framework. This determines how much revenue network companies may recover and what outputs they must deliver. (Ofgem)
Network investment is therefore already financed and recovered over time rather than being charged entirely in the year of construction.
However, consumers still experience the allowed revenues, financing costs and investment programme through network charges included in bills.
The policy question is not simply whether investment is financed over time. It is:
- whether the recovery period reflects the useful life of the assets
- whether the cost of capital is reasonable
- whether current consumers bear too much of the transition cost
- whether some nationally strategic upgrades should receive government-backed financing
- whether network investment should be separated more clearly from the electricity unit price
- how risks and returns are divided between investors, taxpayers and consumers
Capital investment and operating costs should be distinguished
Not all network expenditure should be treated in the same way.
Long-term capital investment
This includes:
- new transmission lines
- major substations
- offshore connections
- strategic reinforcement
- high-voltage cables
- assets designed to operate for several decades
There is a strong case for spreading these costs across the generations of consumers who benefit from them.
Annual operating costs
This includes:
- maintenance
- repairs
- control rooms
- vegetation management
- routine inspections
- system operation
- balancing services
These are continuing costs that must be funded as the service is provided.
A transparent tariff should make the distinction clearer.
Consumers should be able to see how much they are paying for:
- electricity itself
- operating the current network
- constructing the future network
- policy and social programmes
- supplier services
- tax
A national network-access model
Policy Seed proposes separating the price of electricity more clearly from the cost of network access.
Under this principle:
The unit price would primarily recover
- wholesale electricity
- generation-related costs
- electricity losses
- balancing directly associated with consumption
- a controlled supplier margin
A transparent network subscription would recover
- transmission access
- distribution access
- routine network operation
- a contribution toward long-term infrastructure
Major strategic capital projects could be financed over their expected asset life, potentially using lower-cost government-backed or regulated infrastructure finance.
This would not make the network free.
It would make the cost more visible and potentially prevent long-term capital investment from being confused with the marginal cost of consuming one additional kilowatt-hour.
Why this distinction matters
Loading every cost into electricity consumption can make electrification less attractive.
A high unit price discourages households from replacing:
- petrol cars with electric vehicles
- gas boilers with heat pumps
- fossil-fuel appliances with electric alternatives
This can happen even where additional electricity is available at low cost during off-peak periods.
A more transparent structure could separate:
- the cost of having a reliable network connection
- the cost of using electricity at a particular time
- the cost of long-term national infrastructure
- the cost of social and environmental policy
This would allow the electricity price to send a clearer signal about when energy is abundant and when the system is under pressure.
trate that electricity flows are limited by physical infrastructure rather than administrative regional boundaries.
What the evidence does and does not show
The evidence supports several conclusions.
The evidence shows that
- the 2022 gas crisis drove an exceptional increase in wholesale electricity costs
- gas can influence the wholesale price even when much electricity is generated by cheaper technologies
- wholesale prices have fallen from their crisis peak
- consumers pay for considerably more than electricity generation
- Scotland frequently has more generation than local demand
- transmission capacity between generation and demand is constrained
- congestion can lead to renewable curtailment and increased generation elsewhere
- network investment and system operation have become increasingly important to the final cost of electricity
The evidence does not automatically prove that
- renewables caused high electricity prices
- all network investment is caused by renewables
- removing gas from marginal pricing would eliminate every additional cost
- English onshore wind would have removed the need for transmission upgrades
- network costs are currently recovered entirely upfront
- a £15p unit price can be achieved without reform elsewhere in the system
Those questions require transparent modelling.
Key findings
1. The gas crisis caused the initial shock
The extraordinary increase in gas prices explains much of the rapid increase in electricity prices during 2022.
2. Wholesale prices are not the whole bill
Consumers also fund networks, balancing, suppliers, policy programmes and VAT.
3. Cheap generation can coexist with an expensive system
Wind and solar can lower wholesale prices while transmission and balancing requirements continue to add cost.
4. Location matters
Electricity generated in one region has limited value to consumers elsewhere when the network cannot carry it to them.
5. Onshore wind restrictions may have increased dependence on distant generation
Building less onshore wind in England may have increased the importance of offshore and Scottish generation, and therefore the need for north-to-south transmission. The scale of this effect needs to be quantified.
6. Long-life infrastructure requires long-term financing
Consumers should not be led to believe that every increase in the electricity tariff represents a higher cost of generating electricity.
The cost of constructing national infrastructure should be clearly separated and recovered over an appropriate period.
7. Britain should optimise the whole system
The cheapest generator is not always the option that produces the cheapest reliable system.
Generation, networks, storage, flexibility and location must be planned together.
Policy Seed position
Britain’s electricity debate has become trapped between two oversimplified claims.
One side says renewable energy has made electricity expensive.
The other says adding more renewable generation will automatically make bills cheap.
Neither is sufficient.
The more accurate conclusion is:
Renewable electricity can be cheap to generate, but consumers pay for the entire electricity system.
The objective of energy policy should therefore be to reduce the total cost of providing reliable electricity.
That means:
- reducing exposure to marginal gas prices
- building generation in appropriate locations
- expanding transmission before constraints become chronic
- using storage and flexible demand where they reduce system costs
- distinguishing national infrastructure from annual operating expenditure
- financing long-life assets over the period in which they provide value
- showing consumers clearly where each part of their bill goes
The central question is no longer simply how cheaply Britain can generate electricity.
It is:
How can Britain build and operate the lowest-cost reliable electricity system—and ensure that the savings reach consumers?
References
- Ofgem, Energy price cap: default tariff levels and supporting models.
- Ofgem, Energy network price controls and the RIIO framework.
- National Energy System Operator, Electricity Ten Year Statement: Scottish boundaries.
- National Energy System Operator, Electricity Ten Year Statement: North of England boundaries.
- National Energy System Operator, Electricity Ten Year Statement: South Wales and South England boundaries.
- National Energy System Operator, Annual Balancing Costs Report.
- National Energy System Operator, Transmission constraint management.
- Department for Energy Security and Net Zero, Electricity generation cost projections.